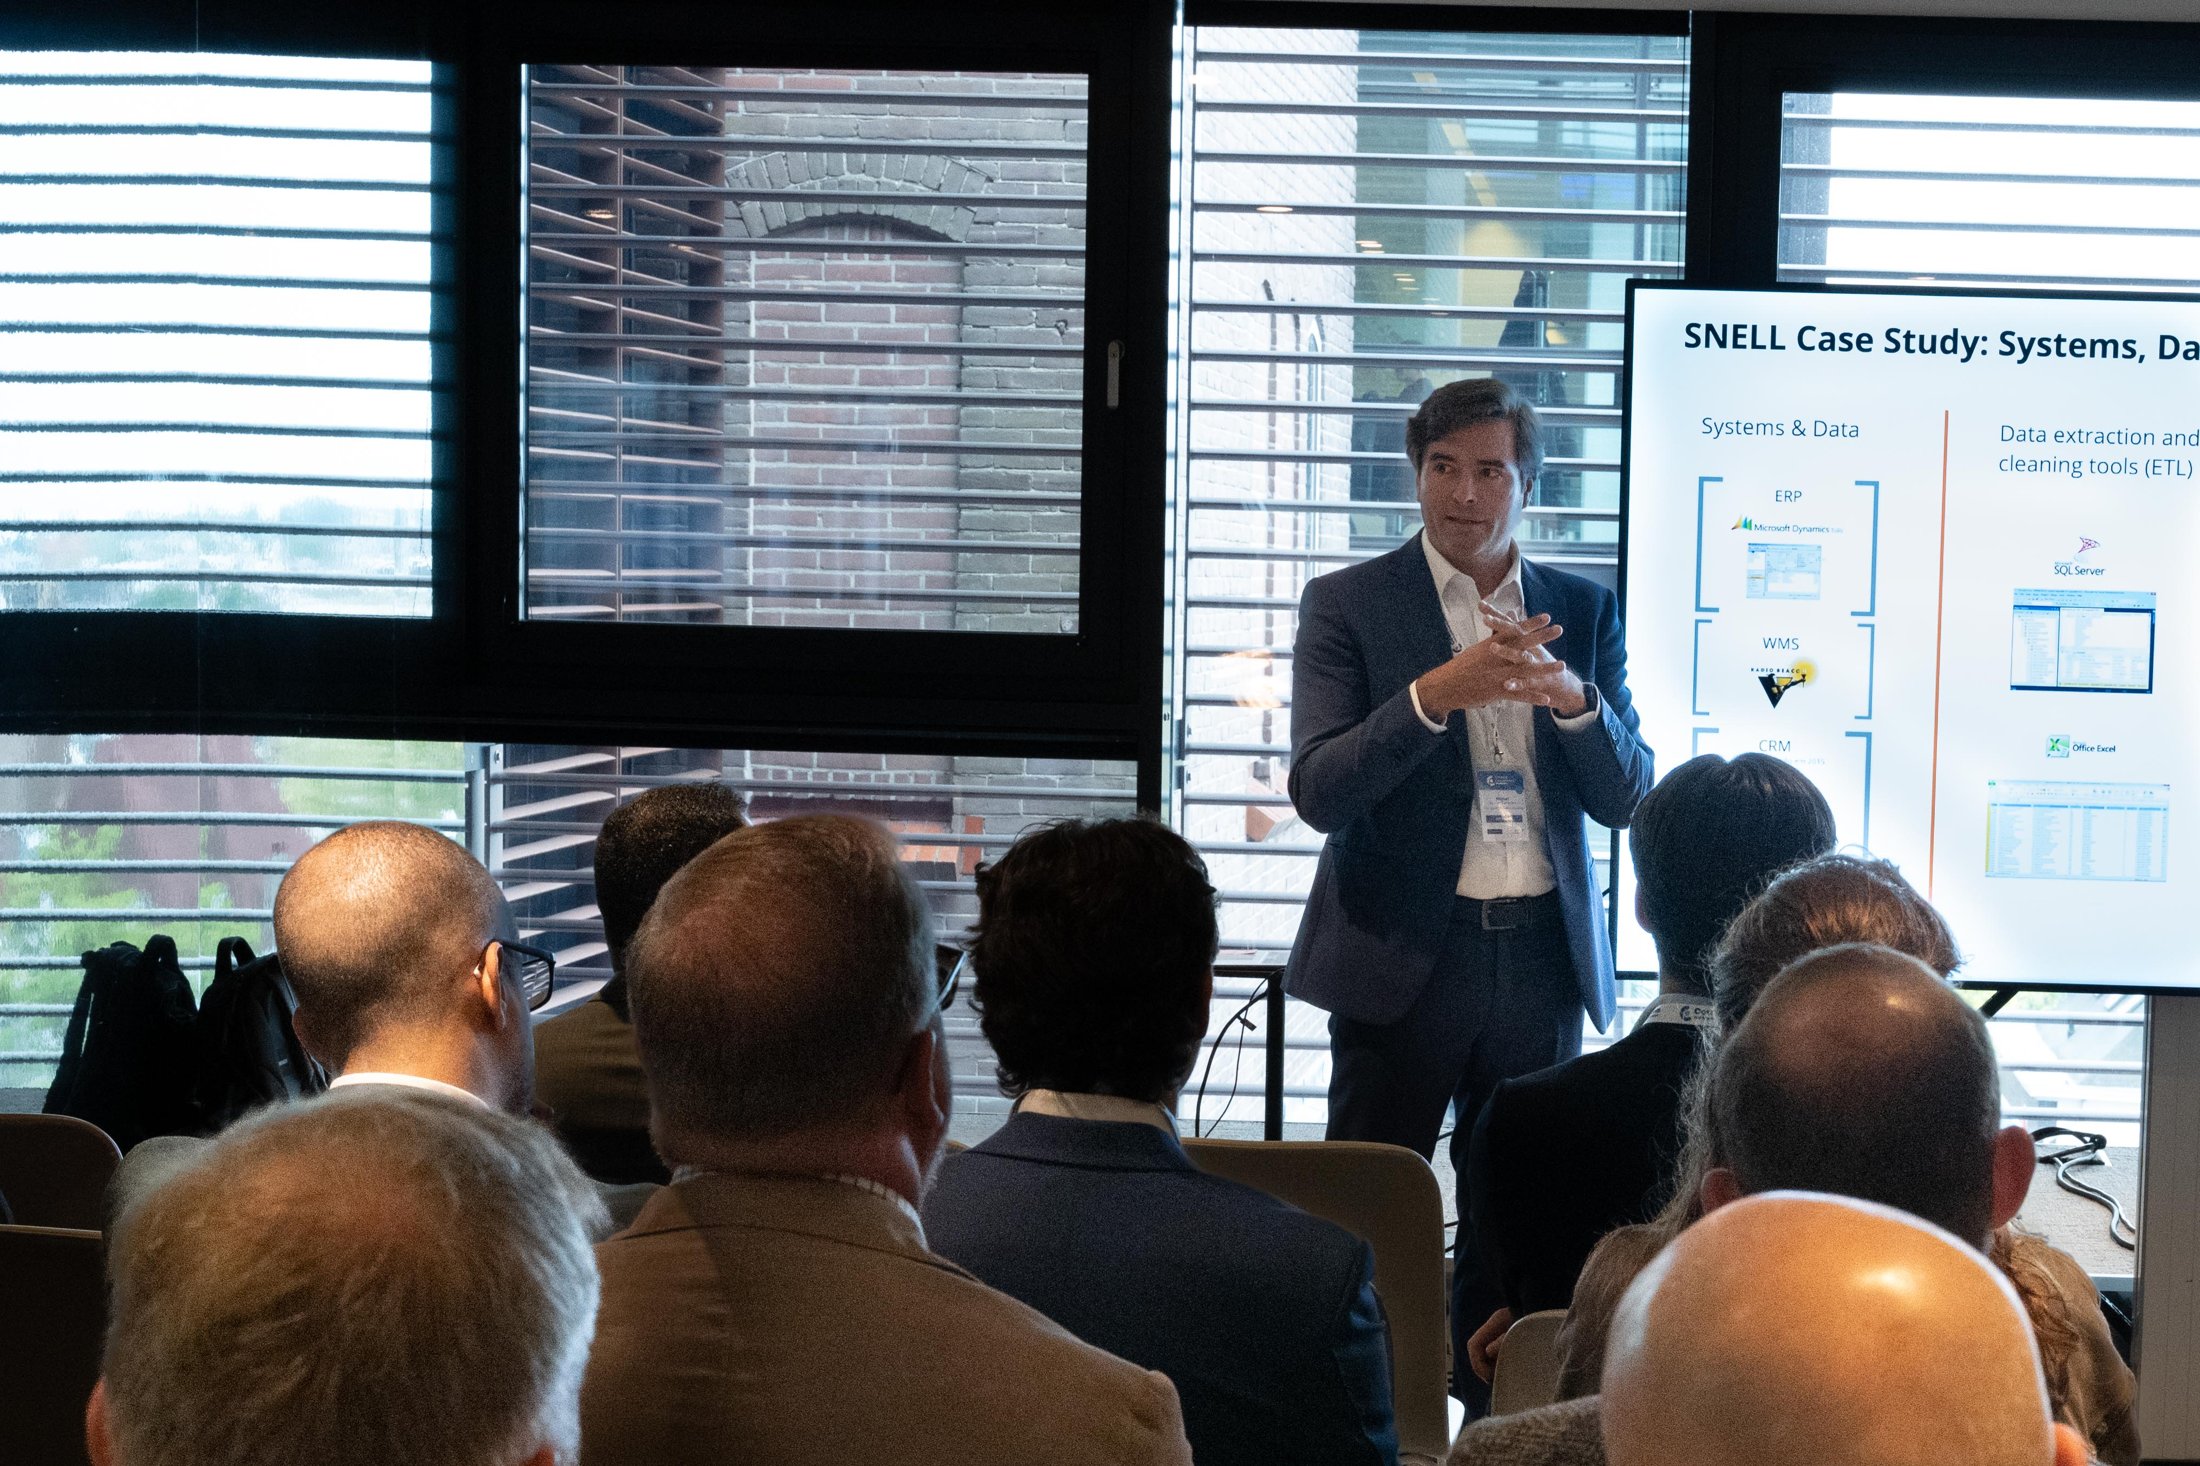
On stage at The Costing Conference, in Amsterdam.
Miguel Guimarães was a guest speaker at The Costing Conference (Amsterdam, 2-3 October 2025), organised by CostPerform. His session - “Using TDABC to Drive Strategic Planning and Profitability Management” - walked the room through a real distribution case study: the whale curve, a customer-profitability heat map and a capacity-utilisation analysis. He shared the stage with costing leaders from organisations such as Saudi Post, Central Garden & Pet, PGGM and the Estonian Health Insurance Fund.
TDABC, taken all the way to a decision.
The talk was not a method lecture. It followed one distribution business from raw operational data to the three views a board actually acts on - built with Time-Driven Activity-Based Costing on the client's own numbers.
The whale curve
Cumulative profit ranked by customer - the shape that shows how a healthy top line quietly funds a loss-making tail.
Customer profitability heat map
Every account scored on what it truly costs to serve, so the pattern is visible at a glance, not buried in the ledger.
Capacity utilisation
Separating the cost of doing the work from the cost of being ready to do it - the analysis that reframes the pricing conversation.
A programme of costing and profitability leaders from across the world - public postal logistics, consumer goods, pension management and national health insurance among them.

- Saudi PostPostal logistics
- Central Garden & PetConsumer goods
- PGGMPension management
- Estonian Health Insurance FundPublic health
- Cost and ProfitabilityTDABC · distribution
CostPerform is a trademark of its respective owner. This mention describes our participation as a guest speaker at the event it organised, with no commercial relationship, partnership or endorsement implied.
Want your own whale curve?
The case study on that Amsterdam stage started the same way yours would: your data, a TDABC model, and the three views that make the decision obvious. Book a 30-minute scoping call.